Lineage graphs are usually accurate and unreadable. A real workspace has 200 views and the graph looks like a bowl of noodles.
Start from the number
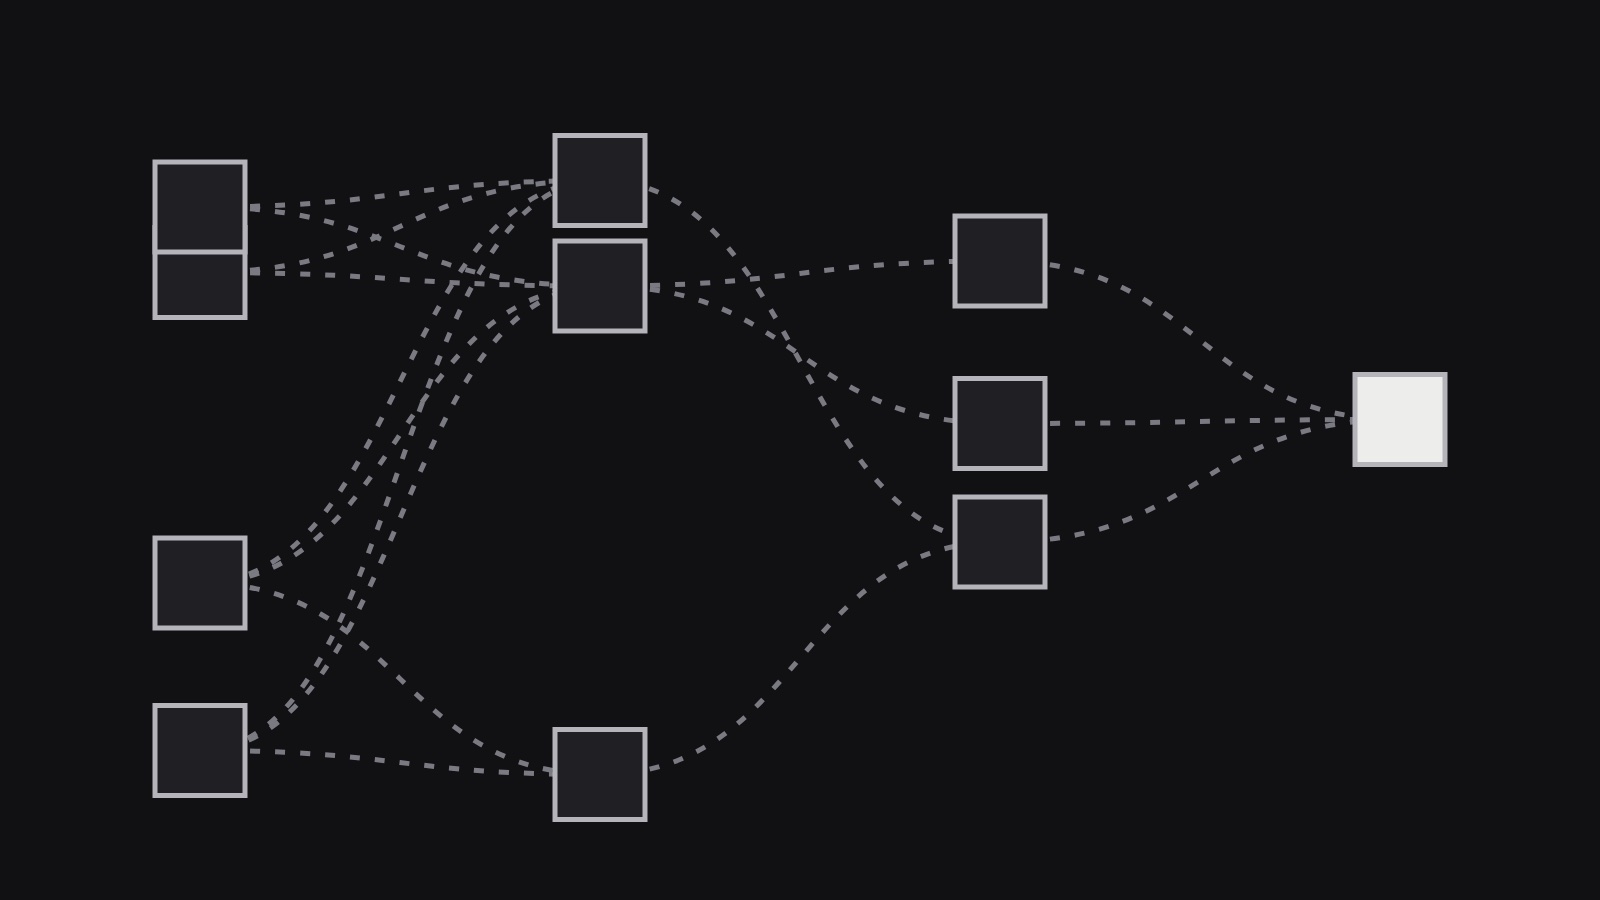
The new view starts from a single value on a dashboard and walks back to the raw events that produced it. Everything that did not contribute is folded away.
- Hops are grouped by stage: ingest, transform, serve.
- Each hop shows its freshness and last change.
- One click opens the SQL that produced it.
In testing, engineers found the source of a wrong number in a median of 48 seconds, down from 11 minutes with the full graph.
Sigrún leads the query engine team in Reykjavík. Before Basalt she worked on storage at a Nordic payments company, where she learned to distrust any latency number without a percentile next to it.